Crises
The Crises tab is divided in two sections:
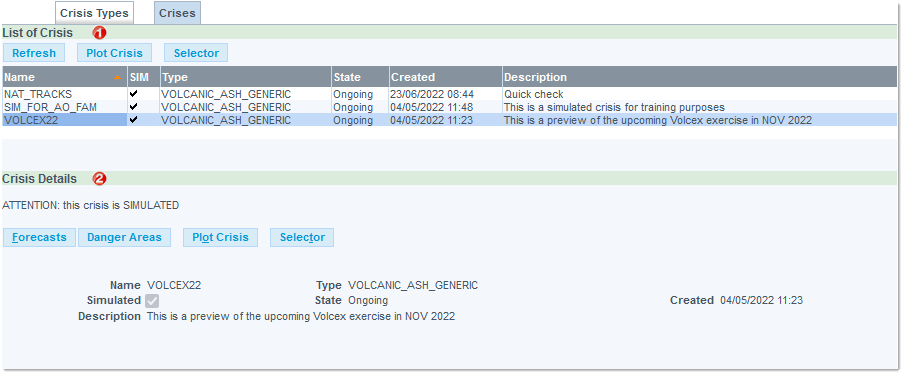
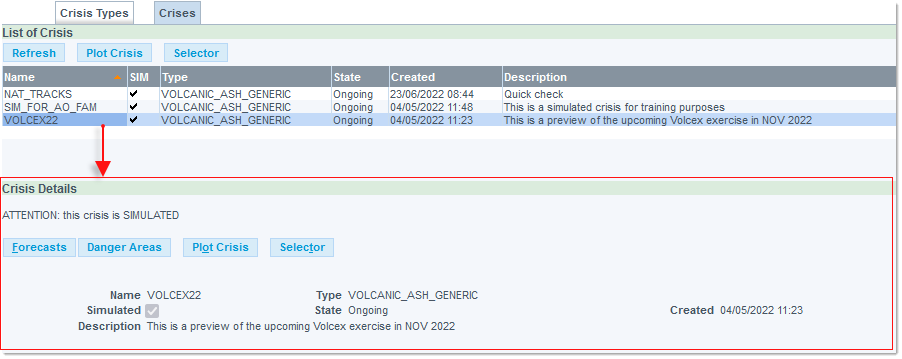
List of Crisis
Button Bar
- Refresh: updates the display after having performed a change in the Crisis list, and/or to get the latest updates.
- Plot Crisis: opens the EVITA Interactive Map to graphically display the selected crisis.
- Selector: opens the EVITA Selector window.
Table
The List of Crisis tab lists the existing crises, in the form of a table:
- Name: the name given to the crisis.
- SIM: indicator that the crisis is a simulated one.
- Type: the type of crisis.
- State: indicates the state of the crisis.
- Created: the creation date and time.
- Description: descriptive text as set in the Description field.
Crisis Details
Click on a table row to open the corresponding Crisis Details pane:
The Plot Crisis and Selector buttons have exact or similar functions to what has been described in the context of the Crisis Types tab => Please refer to the previous chapter.
What is specific to the Crises context is the following:
Further described in their respective section of this document.