Forecasts
You access to the Forecasts view from a Crisis Details section of a selected Crisis:
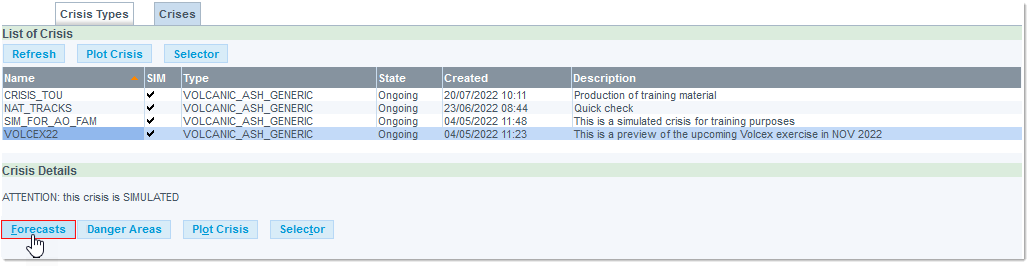
Click on the Forecasts button to open the corresponding EVITA Forecast detached view:
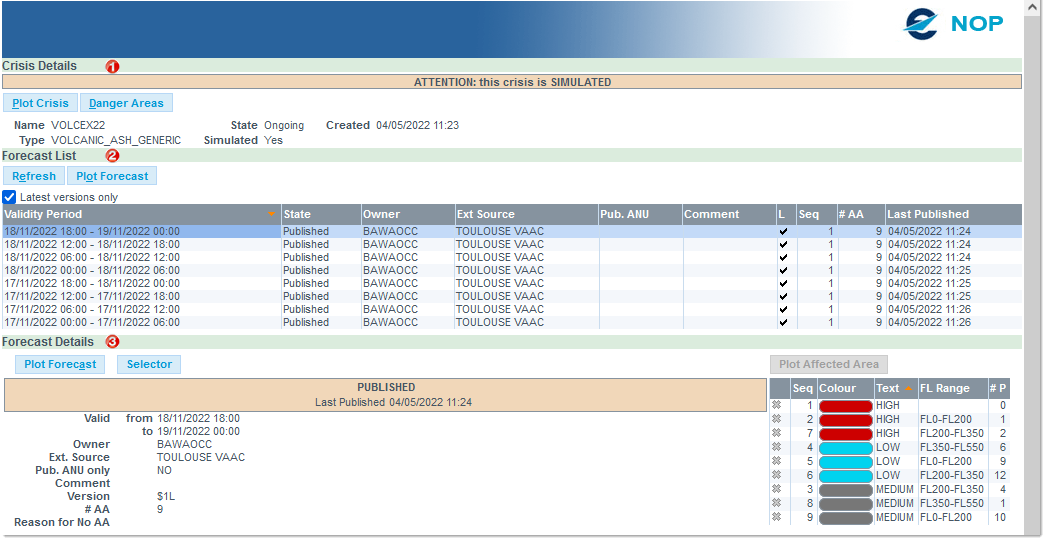
The EVITA Forecast window is divided in three sections:
Crisis Details
- A Button Bar providing links to other EVITA tools:
- Plot Crisis: opens the EVITA Interactive Map to graphically display the concerned crisis,
- Danger Areas: opens the EVITA Dangers window.
- A Crisis Summary, listing the following parameters: Name, Type, State, Simulated and Created.
Forecast List
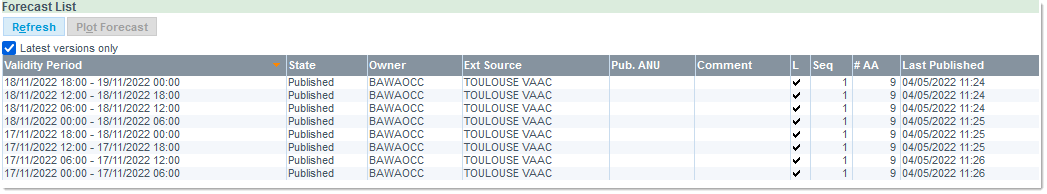
The Forecast List section features the following elements
- Two action buttons: Refresh and Plot Forecast;
- A Latest versions checkbox: to filter the displayed list down to the latest items;
- A Table listing the Forecasts.
All columns are straightforward - # AA stands for number of Affected Areas.
Refresh
You may need to click on the Refresh button every now and then to display the most recent changes and modifications - from you and as well as from other users.
Plot Forecast
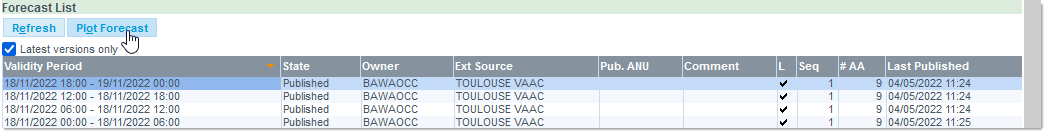
The Plot Forecast button provides another path to plotting the selected forecast on the EVITA Interactive Map.
Forecast Details
The Forecast Details section displays the details of the selected Forecast:
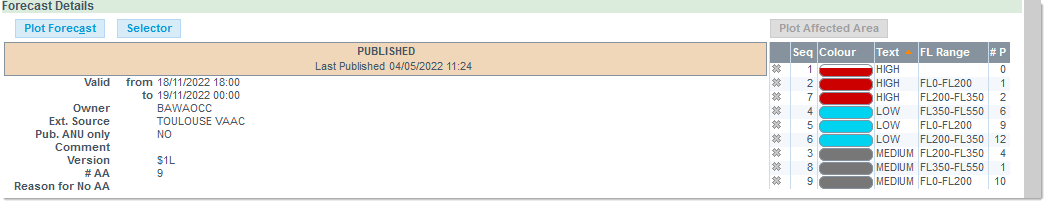
Two action buttons are available from here:
- Plot Forecast (already described);
- Selector: to open the EVITA Selector detached view.