| Typical Scope: |

Two versions of the Traffic Counts application are currently accessible: Traffic Counts 2 and Traffic Counts.
Traffic Counts is the version currently available on the NOP Portal - and also accessible from the NOP Desktop Start menu - this is the one described here.
Traffic Counts 2 is the new version, integrated in the STAM Applications suite. Please refer to this section for information on the Traffic Counts (2) application.
The Traffic Counts Portlet gives the number of flights for a given Traffic Type. Flights may be selected on different query criteria for given time period and interval.
The flights can be selected on :
- The time over the reference location for a traffic Volume and a Point.
- The take off time for the Aircraft Operator, the Departure Aerodrome and Aerodrome Set.
- The arrival time for the Arrival Aerodrome and Aerodrome Set.
- The entry time for the Airspace.
Query Area
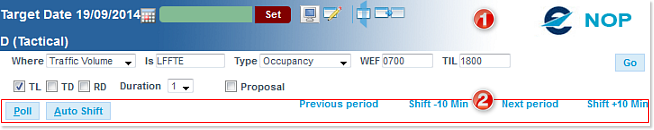
1 The Query Area, when first opened, presents the following parameters:
- Where: shows the last element type used with a query - by default, Traffic Volume.
- Is: based on the "Where" selection, the drop-down box will propose the most recent query data elements you have queried before with success.
- Type: the following Count Types may be available depending on the selected Where criteria:
- Entry Hour/20 Min: Entry hourly counts are given every 20 minutes step.
- Entry Hour/10 Min: Entry hourly counts are given every 10 minutes step.
- Entry Hour: Entry hourly counts are given every 60 minutes step.
- Entry 20 Min: Entry 20 minutes counts are given every 20 minutes step.
- Occupancy: Occupancy counts are given at the beginning of every minute.
- WEF time: proposed based on the default query period assignment using your user adjustable preferences.
- UNT time: proposed based on both the selected WEF time and on the default query period assignment..
- Traffic Type: The following Traffic Types can be checked or unchecked:
- TL: Traffic Load
- TD: Traffic Demand
- RD: Regulated Demand
- Proposal: check this option to include the proposed flights in the retrieved counts. Otherwise the counts will be based on the normal flights only.
2 When a query has been launched, additional control and navigation elements appear to fine tune the current query:
- Poll: button to activate the Polling mode
- Auto Shift: automatically shift the query period, according to the current time
- Previous period: go to the previous query period
- Shift -10 Min: shift the query period 10 minutes backward
- Next period: go to the next query period
- Shift +10 Min: shift the query period 10 minutes forward
Result Area
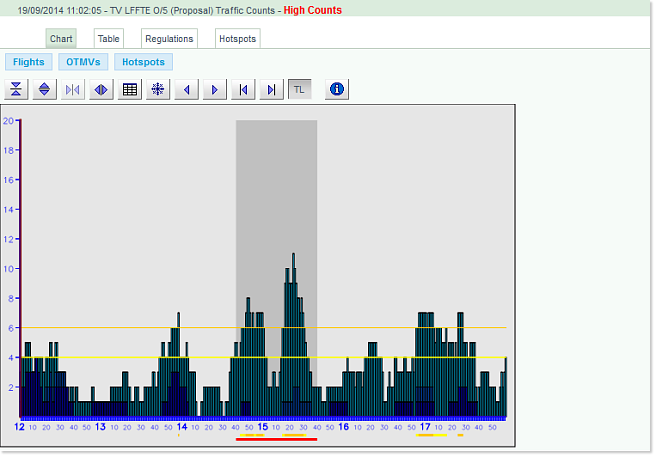
Click on the Go button from the Query Area to generate the Chart on the Occupancy Count window, displaying traffic counts, and OTMVs (when existing):

The Result Area features 4 tabs:
- Chart (by default)
- Table
- Regulations
- Hotspots
The Chart Tab
Presents the data in a Chart mode (as described above):
Tools and commands
In Chart mode, the Display Area features a dedicated Tools bar:

 : Enlarge the scope of the vertical scale
 : Reduce the scope of the vertical scale
 : Enlarge the scope of the shown period
 : Reduce the scope of the shown period
 : Toggle the Grid visibility (on or off)
 : Freeze / Unfreeze the shown period for new queries
 : Move Chart selection to the left
 : Move Chart selection to the right
 : Scroll Chart to the left
 : Scroll Chart to the right
 : Toggle Traffic Load (on / off)
 : Toggle Traffic Demand (on / off)
 : Toggle Regulated Demand (on / off)
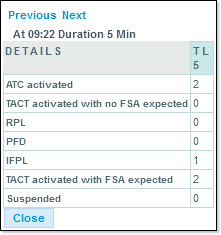
 : Get Info on the selected segment of the Chart:
Action Buttons
The Chart tab features 3 action buttons:
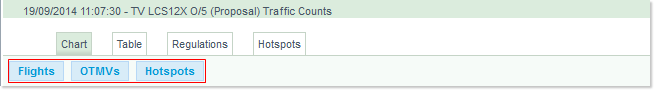
- Flights
- OTMVs
- Hotspots
... each opening their respective editing environments with the basic set of query parameters already pre filled. They also provide a simple and practical workflow:
- Select flights and add them to a STAM
- Create the OTMV
- Define the Hotspots
- ...
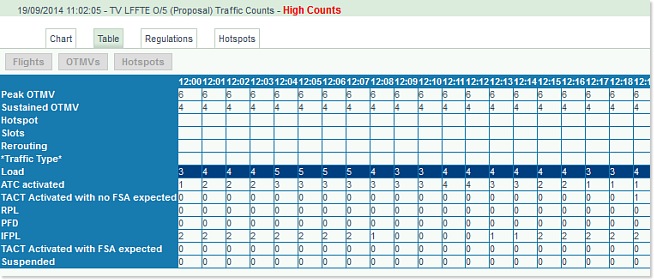
The Table Tab
Presents the data in a table mode:
The Regulations Tab
The Regulations tab provides the list of regulations applied to the selected Traffic Volume, for the defined period.
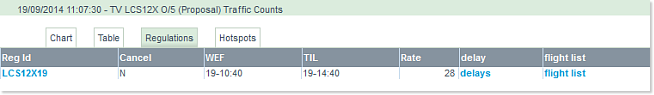
It also provides useful shortcuts (in light blue):
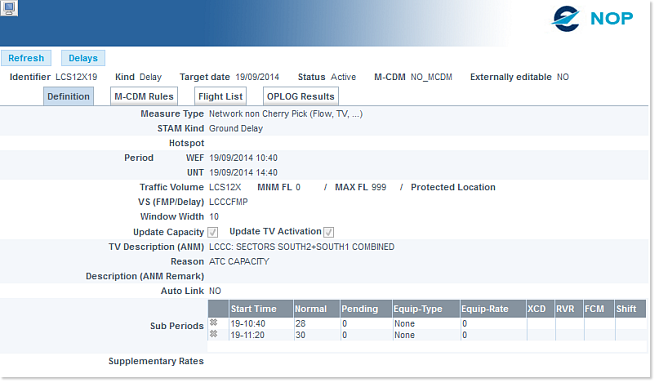
- Reg Id: the link opens the Measures Portlet with the Regulation Details tab already selected, and the Regulation ID pre filled ... you only need to click on the Go button to open the Measures Editor and, when authorised, make changes to the selected Measure:
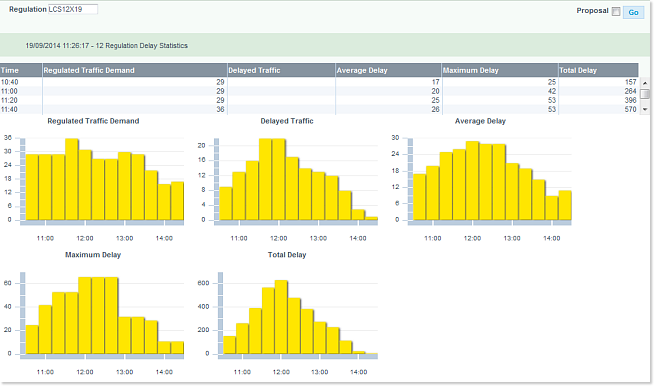
- delays: the link opens the Measures Portlet with the Regulation Delays tab already selected:
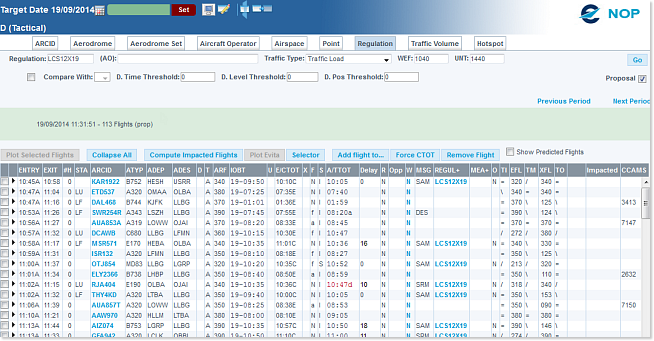
- flight list: the link opens the Flight List Portlet, listing all flights impacted by the set regulation:
The Hotspots Tab
The Hotspots tab provides the list of hotspots created in the Traffic Volume.
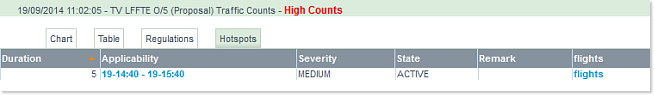
It also gives access to the Hotspot and the Flight List windows (click on the appropriate link).