A series of controls and indications are grouped at the bottom of the Map display:

They comprise the following features:
Multiple tools can be used at the same time, and the active components have their icon painted in green - as in this view, which is actually the default when you first open the CRISIS Map:
Saved Settings
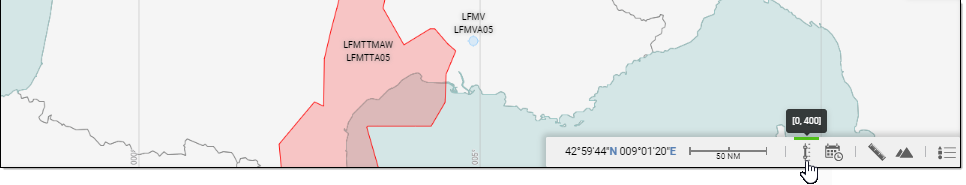
Whenever some changes have been applied to the settings of a filter, the corresponding icon gets a green band to reflect the customisation:
Even when the filter is deactivated and its layer removed from the map, the settings are persisted:
These settings are kept for the time of your session, and cleared when you close the Map window.
Show Settings
Filter settings are revealed in a tooltip when you mouse over the filter icon:
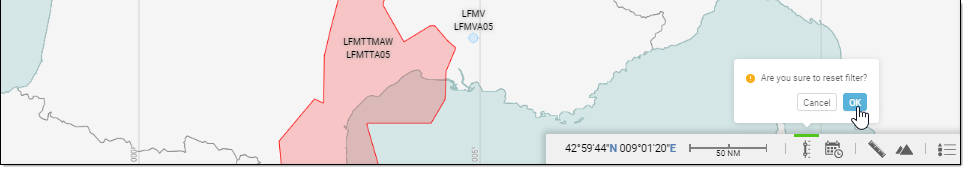
Reset Filters
Active filter settings can be manually reset (right-click on the target filter):
Info Section

 Coordinates: Indicates the coordinates of the point designated by the tip of the mouse pointer.
 Scale: Indicates the scale of the map as set by the current zoom factor (ranges from 2 NM to 2000 NM).
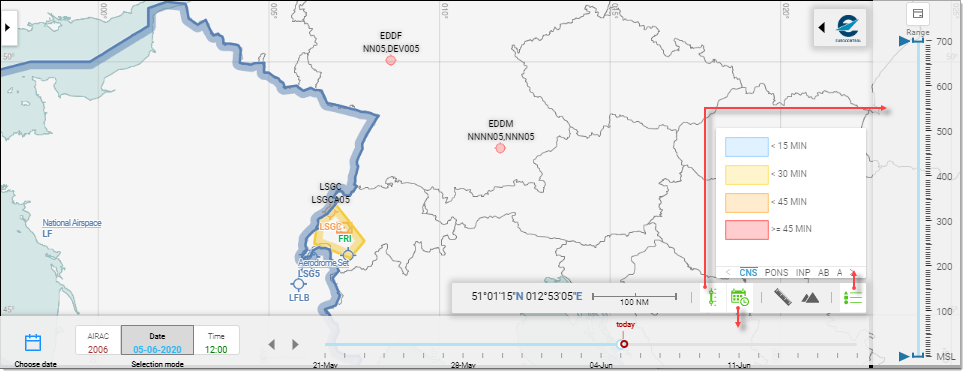
LevelBand

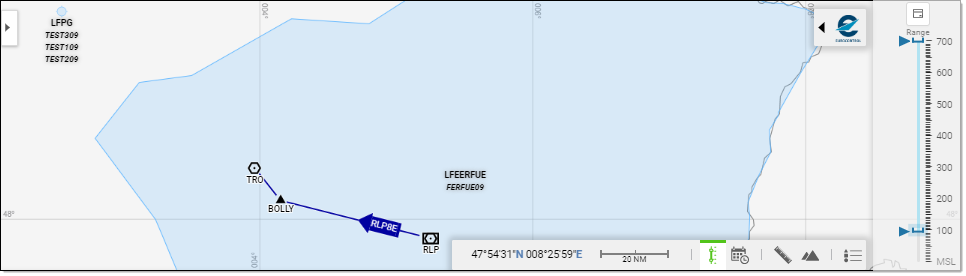
The Levelband serves to specify the Range inside which Entities and all related objects are to be drawn or displayed on the map.
By default, the Range is MSL > FL700: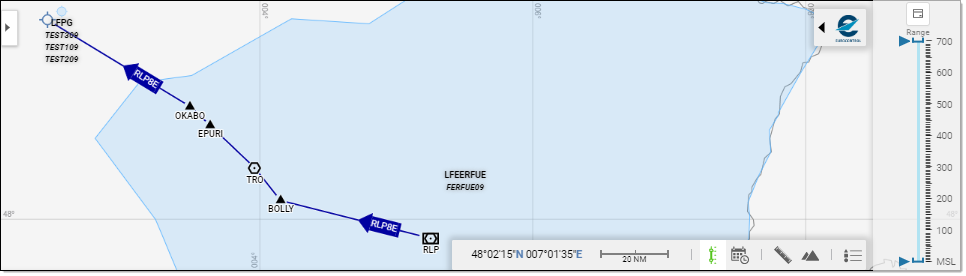
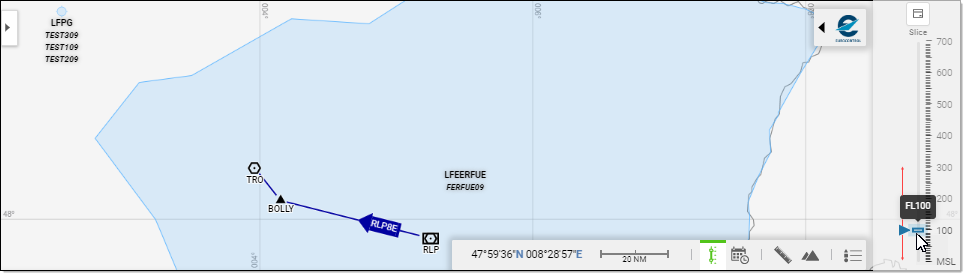
Range Mode
To specify a given Range, use the mouse pointer to set the Upper and/or Lower slider to the desired value - see how moving up the Lower value up to FL100 impacts the display:
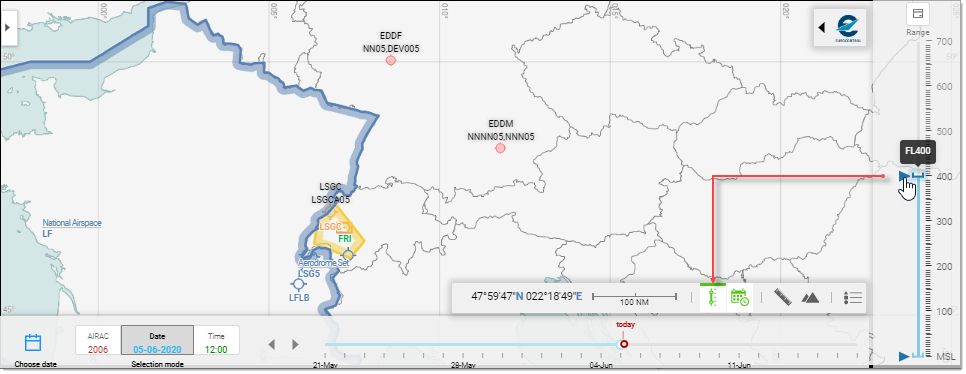
Slice Mode
You can alternatively use the Slice mode to select a single FL value that you can move up or down the scale.
Use the  button located on top of the vertical FL scale to toggle between Range and Slice mode:

Timeline

Objects and layers plotted on the Map have a specific timestamp and validity and so may vary in the course of the day, the week, the year, ...
Use the Timeline component to dynamically reflect the changes on the map (showing or hiding objects or entities, changing color, ...).
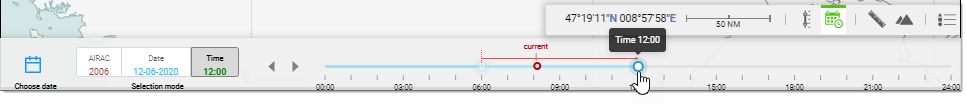
Selection mode
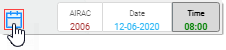
Three time scales are available, from coarser to finer time resolution: AIRAC, Date and Time:
- In AIRAC mode, the available increments are AIRAC numbers:

- In Date mode, the available increments are Dates:

- In (UTC) Time mode, the available increments are block of 60 minutes:

Set target Date - by Calendar
Click on the  Calendar icon ...
... then pick the target date from the Date Picker (Date Mode left, AIRAC Mode right):
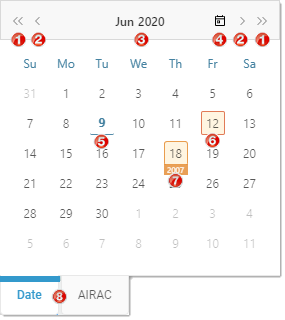
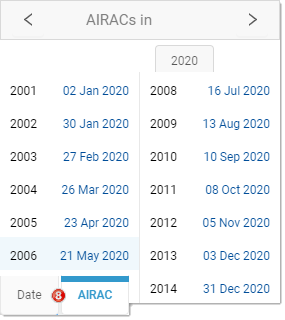
- Backward and forward incremental navigation from Year to Year,
- backward and forward incremental navigation from Month to Month,
- Display of the Month and Year of the date currently selected - each providing link to select different Month and Year respectively,
- Shortcut to select the date of Today,
- The date of Today,
- The Date currently selected,
- AIRAC date,
- Tabs to toggle Mode from/to Date and AIRAC.
Tip: You can also use the following keyboard shortcuts:
Previous Year (keyboard shortcut: Ctrl + Left)
Previous Month (keyboard shortcut: PageUp)
Next Month (keyboard shortcut: PageDown)
Next Year (keyboard shortcut: Ctrl + Right)
Set target Date - By increment

Use the  Backward / Forward arrows to move the timeline back or forth by 1 incremental unit (Day in this case).
Set target Date - via the Timeline
Click on the  End handle to activate it
  , keep the mouse button down and move the pointer along the timeline to the desired location, then release the mouse button:

Set target Time - by increment
Use the Backward / Forward arrows to move the timeline back or forth by 1 incermental unit (Hour in this case).
Set target time - via the Timeline
Click on the End handle to activate it , keep the mouse button down and move the pointer along the timeline to the desired location, then release the mouse button:
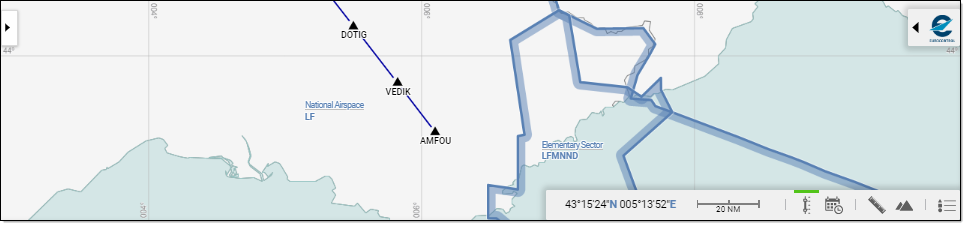
Measuring Tool

This tool allows you to draw a straight segment between locations identified by a sequence of left-click selection and compute both the segments length and the running total length based on the sum of the shortest distances on great circle to go from one point to another point, expressed in NM:
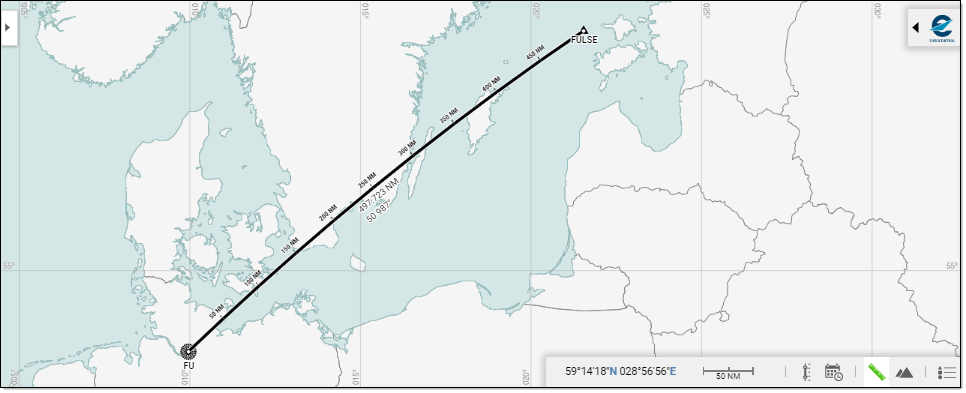
Note: Keep the <Ctrl> key down do draw a sequence of segments - Double-click to mark end point - and Right-click to delete the measure(s).
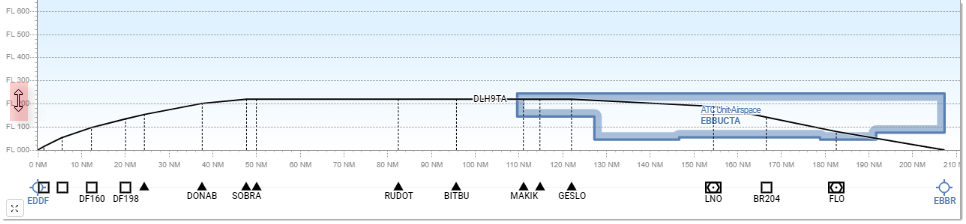
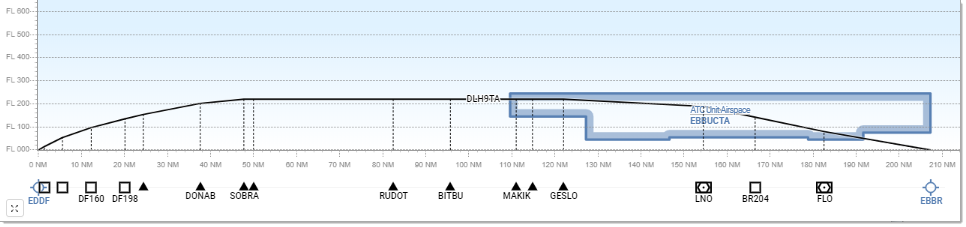
Vertical View

The Vertical View tool allows you to visualize how a given selected flight intersects with the vertical definition of crossed Airspace(s):
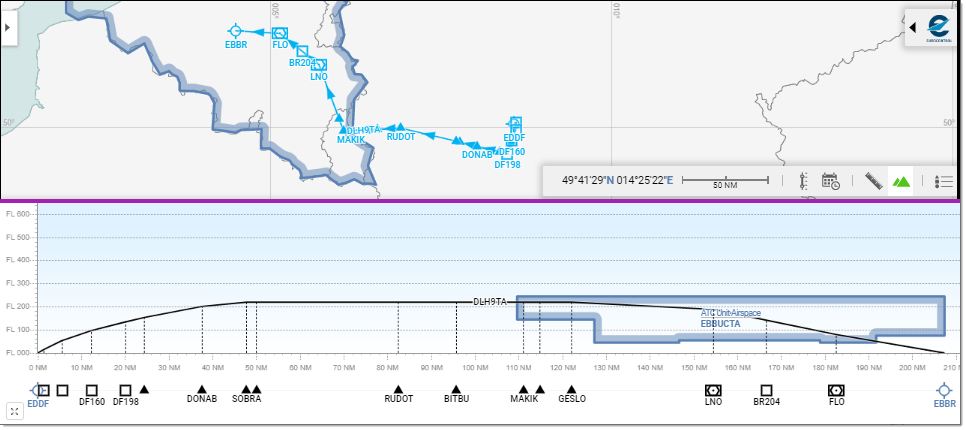
The FL axis provides the adjustable vertical scale. The NM axis displays, in addition to distances expressed in nautical miles, the various Waypoints and other Significant Points.
Controls
Scale
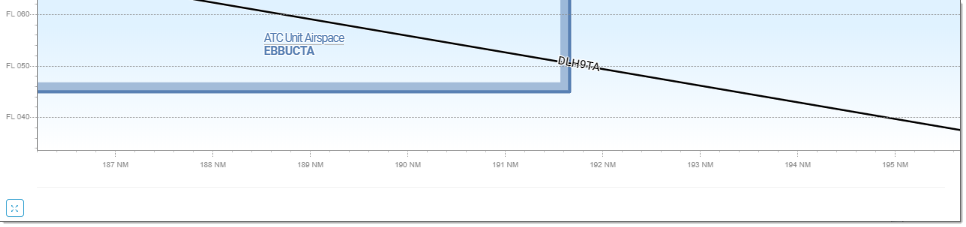
Mouse over the FL and roll the mouse wheel up or down to change the vertical scale of the graph:
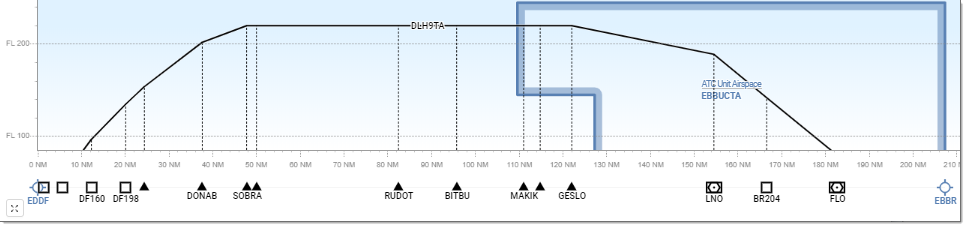
Likewise, mouse over the NM axis and roll the mouse wheel up or down to change the horizontal scale of the graph:
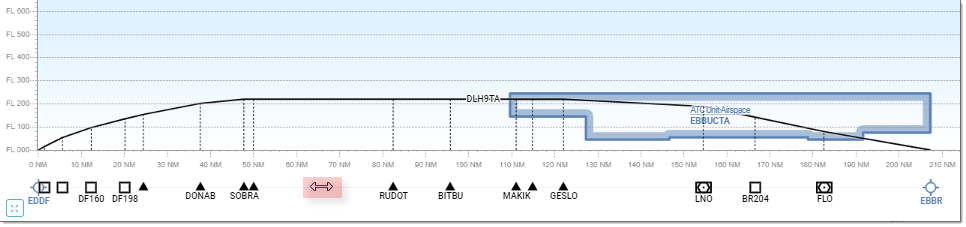
Zoom
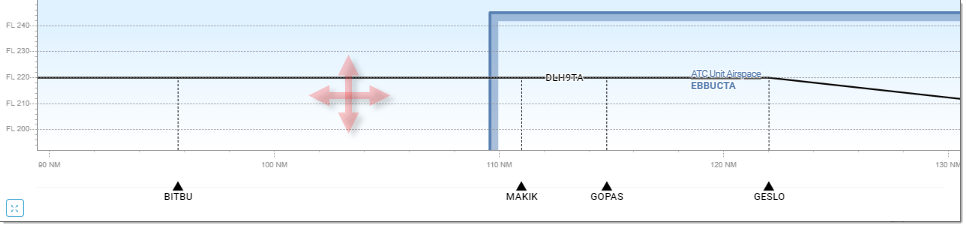
Mouse over the graph and roll the mouse wheel up or down do zoom out or in:
Move/Pan
Click and drag the graph to display the desired area:
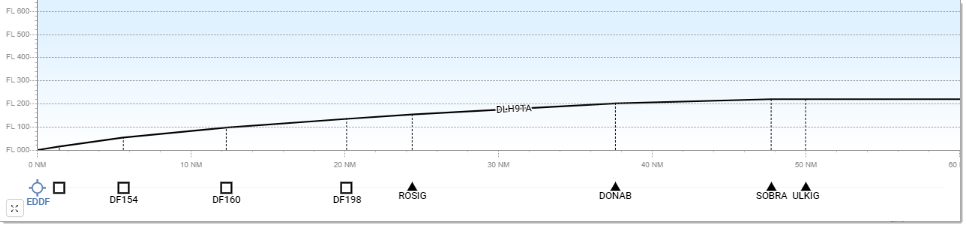
Fit to window
Click on the ![]() Fit icon ...
Fit icon ...
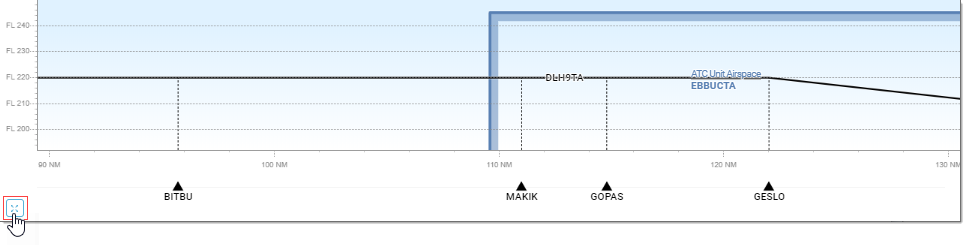
... to reset all zooming factors in such a way that the Flight profile is displayed in full in the available window space:
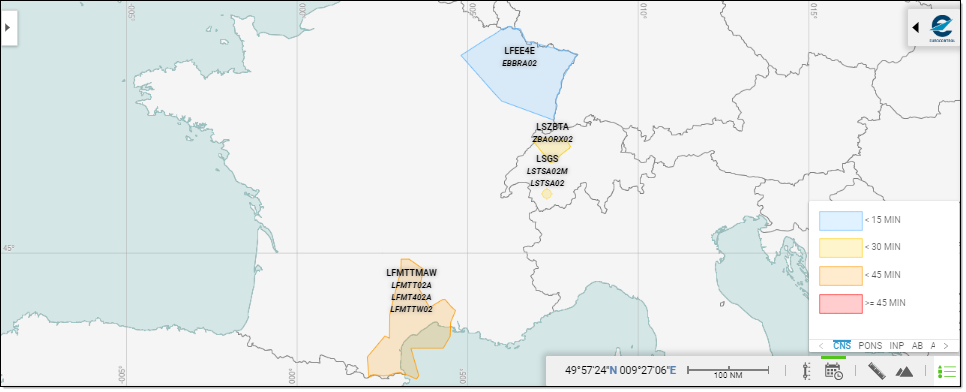
Map Legend

The Map Legend tool provides compact access to the meaning of the various icons and symbols you may find on the Map: