To open a map, go to the toolbar menu ‘application –> map –> map view’.
figure 1: map view menu
The map will also be open when an object is plotted via a plot menu option or icon on the tool bar
figure 2: map plot
the mouse cursor can have different behaviours. they are called mouse behaviour modes.
they are selectable in the (right-click) contextual menu (mode), or in the action > mode drop-down menu, or more directly in the toolbar, or even better: using keyboard shortcuts.
the keyboard shortcuts are listed in the menus.
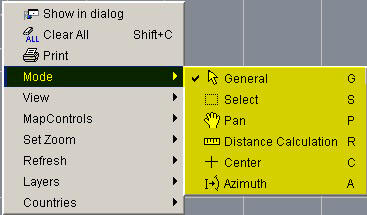
figure 3: action mode ‘drop-down menu’

the way to interact with the map will depend on the selected mode. the default mode is the ‘general‘ mode.
the mouse cursor will show in which mode you are by its shape.
the right mouse button behaves the same throughout all cursor modes.
the right click is always used to pop-up the contextual menu. this is explained earlier (see 1.4 for more info about it).
from the contextual menu an object can be displayed individually
1) graphically using shift + mouse click (any button)
2) opening its datasheet by just clicking on the id of the object in the menu.
3) if displayed, can also be removed from the map by doing shift + mouse click like at point 1)
button: 
cursor shape: 
keyboard shortcut: g
this mode offers the most possibilities. it was designed to optimise the use of the mouse and allow a smooth navigation in the map.
left mouse button:
pan.simply clicking will not do anything good. you must press the button, keep it pressed and drag your cursor across the map to draw a white rectangle. then only release the button.
you will notice that the mouse cursor takes briefly the following aspect: 
this means that zoom actions are being performed.
zoom in: draw your rectangle down (left or right does not matter). the content of the rectangle will fit the whole map when button is released.
zoom out: draw your rectangle up (left or right does not matter). the content of the whole map box will fit the rectangle.
middle click: re-centre.
the present CHMI does not recognise wheel mice, but middle buttons.
later versions shall not have this limitation any more.
middle clicking will set the position of the mouse cursor to the centre of the map. zoom is not affected.
briefly, a pan symbol will be shown  .
.
ctr+ middle click: azimuth filter.
pressing in sequence 1/ the keyboard key ctr and 2/ the wheel will activate the azimuth filter.
button: 
cursor shape: 
keyboard shortcut: p
although the re-centre function in general mode does more or less the same thing, this mode has been implemented for your ease.
left mouse button:
zoom pan.very simple:
press the button, keep it pressed and drag your cursor across the map. then release. the map will shift along the segment you drew.
middle click: no action.
buttons: 
cursor shape: 
keyboard shortcut: r
with the distance calculation you can measure distances & radials on the map, and, if you enter a speed in the distance calculation box you also have the time.
activate it and play with it.
what needs to be said here is that a ‘snap’ system is used to help designate the origin and destinations, so you can be accurate.
this system will detect any pt or ad that stands below the mouse cursor and propose it to you in the distance calculation box.
simple clicks select a target, double-clicks start a new calculation.
figure 5: distance calculation
to leave the distance calculation mode, just return to another mode.
although the azimuth filter can be activated directly from the general mode, an azimuth mode has been implemented for your ease (don’t you remember the keyboard shortcut?).
button: 
cursor shape: 
with the azimuth filter, you can set a filter for a specific angle and direction.
what does that mean?
basically, it will display routes in a certain direction, and hide others:
an azimuth tool enables you to determine both at the same time:
the routes that match these two direction criteria will be displayed. the other ones will be hidden.
the two figures below will help you understand:
figure 6: route network above paris fl240 no filter
figure 7: same azimuth south/90 degrees (in yellow)
these two figures represent the route network (with ap/dp’s) above paris at fl240.
the first one is not filtered: everything is represented.
the second one is filtered. you can see the azimuth tool in yellow. it is oriented south (axis), and has an aperture angle of approximately 90 degrees. therefore, only the route tracks that are between roughly radial 160 and 200 are represented. the rest is hidden.
play with the azimuth tool. you will notice that the angle can vary between 360 and 1 degree.
therefore, you can imagine that coming back to unfiltered view can be done by setting the angle to 360 degrees.
but there is an easier solution: the  button (toolbar). this will disable/able the azimuth filter.
note that this button is synchronised with the corresponding box on the map configuration filtering tab. see 1.5.2.
watch out for the azimuth symbol  at the top right corner of the map. when this symbol is shown, the filter is active. otherwise it is not active. it also indicates the direction of the azimuth.
2.other map controls

figure 8: other map control
we already saw all options earlier except the ones that are underlined above.
1.  show/hide altitude meter. self-explanatory, but caution: this does not deactivate the altitude filter itself.
2.  show/hide time meter. remember that the altitude filter cannot be deactivated (cf. 1.2).
3.  show/hide map overview.and properties. more about the overview: cf.1.7.
4.  enable disable azimuth filter
5.  fit on selection. this function will list all layers and all objects that have been sent to the view, allow you to select one of them, and auto-fit the map on it (self-zoom).
see on the example below, an auto-fit has been made on eb aerodromes:
6.  save as image : will export a snapshot of the map in a gif or jpg format. those format are the best for internet use. (best lightweight/lossy ratio)
7.  that gives you the map Configuration panel
8.  that gives you the map legend, one tab per domain of data.
9. 
3. dynamically time dependant
on top of the map, see:


figure 12: double-click on cursor
figure 13: band move on cursor
for example, to verify access conditions on routes, you could display a route scenario that is time dependant (week & we routes) and ‘play’ with the time to verify its consistency on a single glance.
there is no way to disable the time. think about it: the system cannot show all times at once, or neither no time at all.
be aware that the default time on opening a map is the current date time. except if a flight is plotted, then it’s the flight time. if a monitor is plotted, it’s the monitor’s time.
the altitude filtering can be disabled in the map configuration. in this case, its control (here highlighted in yellow) is greyed out (inactive).
only entities that contain level information in their own definitions will be affected. typically: as, rt, flight and monitor.
the other entities are virtually available at all levels.
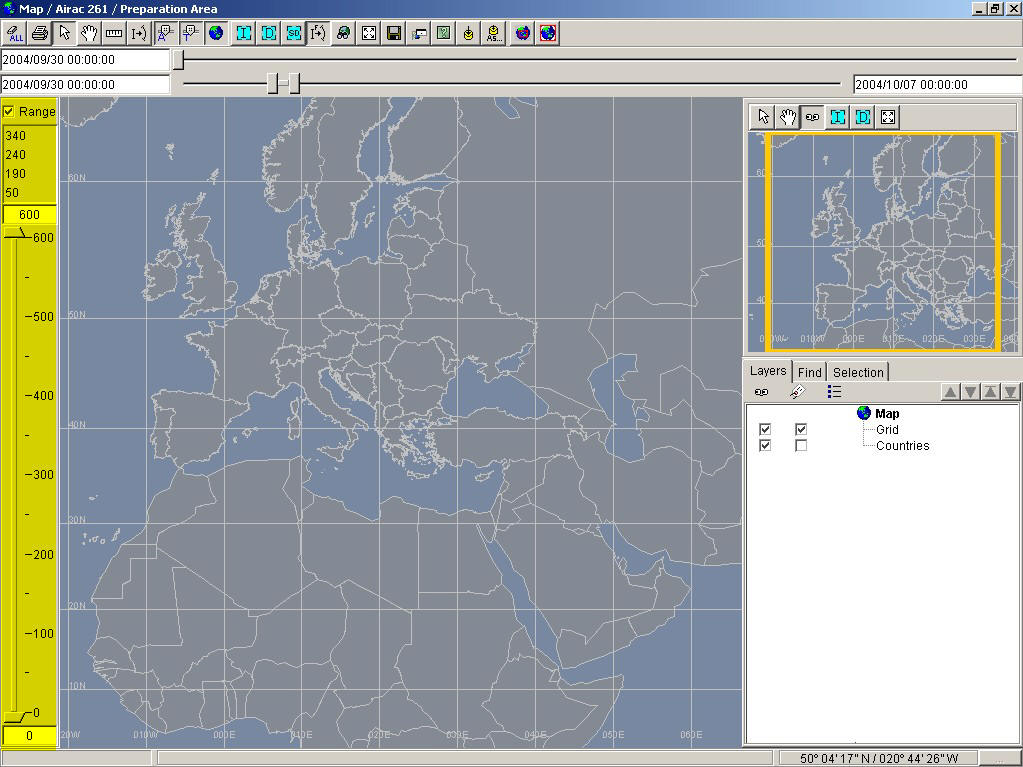
figure 14:altitude filter controls
be aware that the default level band on opening a new map is gnd to unl
two modes are possible: single level or range.
to leave the distance calculation mode, just return to another mode.
a.single level mode
the 'range' button must be deselected. only one cursor is shown.
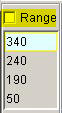
figure 15:altitude filter controls
this is the default mode.
the ‘range’ button must be selected. two cursors are shown.
let’s note here that selecting a level range gnd-unl will have the same effect as deactivating the ‘altitude filter’ in the map configuration.