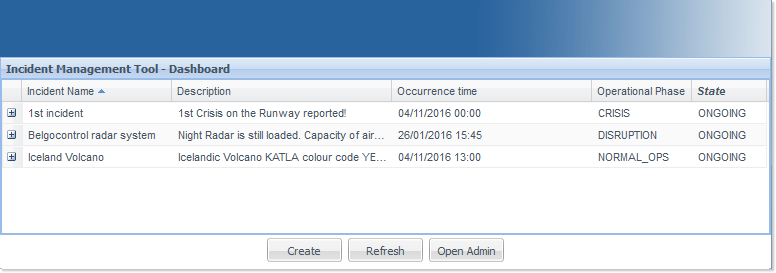
The Incident Management Tool - Dashboard detached view lists all ongoing incidents, and displays a short status of activities.
It initially features a 5-column tables:
- (unnamed):
 maximize/
 minimize button, to respectively display or hide the list of Roles having performed an Activity on the incident, along with the corresponding Activity performed:
The list is ordered by Role: the same Role order present in the loaded Configuration for that incident - please refer to the Incident Configuration section for more information.
Note: In cases where no activity has been logged for the incident, an explanatory text is displayed: 'No Activities logged for this Incident'. - Incident Name: the name of the incident.
- Description: a short descriptive text.
- Occurrence Time: the date and time of the occurrence.
- Operational Phase: the current Operational phase containing the incident. It can be one of the following: NORMAL_OPS, PRE_ALERT, DISRUPTION, CRISIS or RECOVERY.
- State: the current state of the incident. It can be one of the following: ONGOING or CLOSED.
Sorting Columns
Clink in the desired column header and use the  down arrow or
  up arrow to sort the column content respectively in descending order or ascending order.
Showing/Hiding Columns
From the  down arrow appearing to the right of a column header over which passes your mouse pointer, use the Columns menu to select / deselect the titles of the column you want to respectively show or hide from the table:

 and
and  commands.
 Resizing Columns
The width of the columns can be adjusted to your need - move your mouse pointer to the column separator you want to adjust until the pointer changes to the  split symbol ... :

... and drag it to the desired location:

Filtering Columns
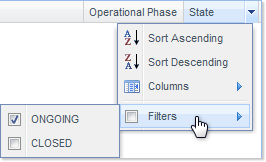
From the same  down arrow, you have access, when relevant, to the Filters option:

You can use this feature to turn On of Off the application of a filter to the concerned column - and specify the filtering parameters.
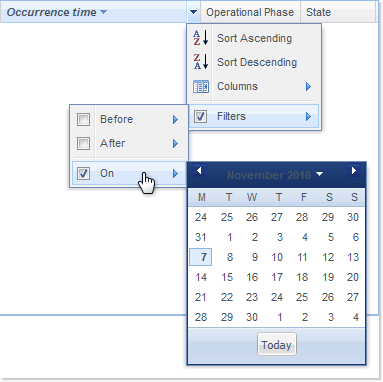
When a filter is activated, the corresponding column header is displayed in italics (Occurrence time in this example):

Filtering parameters
- Description: Enter free text;
- Occurrence time: choose one of the mutually exclusive options (Before, After and On) and specify the Occurrence time with the date picker;
- Operational Phase: select one or more options from the proposed list: NORMAL_OPS, PRE_ALERT, DISRUPTION, CRISIS and RECOVERY;
- State: select from the proposed list: ONGOING and/or CLOSED.
Sorting Steps
Clink in the desired column header and use the  down arrow or
  up arrow to sort the column content respectively in descending order or ascending order.:
Button Bar

Three action buttons are also part of the Dashboard layout:
- Create: used to create an Incident,
Attention: the Create button is only displayed when the proper configuration is loaded and the allowed user is connected - see the Incident Configuration section for more information. - Refresh: refreshes the list of incidents,
- Open Admin: opens the Incident Configuration window.